Creating Tables
In the OfficeReports App you can create tables using drag and drop from the Data Editor:
In Excel or in the OfficeReports App: Select a empty cell in the workbook and click ‘Table -> Create Table’ or right-click the mouse in an empty cell click 'Create Table'. Before we start creating tables, there is a few things you should know about OfficeReports:
Table Layout
Important: Depending on the output you need, OfficeReports creates tables in either the selected 'PowerPoint' or the selected 'Excel' layout. If Excel is opened from PowerPoint, the 'PowerPoint' layout will also be used in Excel.
You can change the default Table Layout by clicking Table Layout in the OfficeReports ribbon tab. Read more about Table Layout.
Default Settings
Important: Save huge amount of time creating tables by setting the correct default settings, so OfficeReports automatically uses the correct settings for the tables you create.
In the OfficeReports ribbon tab, click 'Table Settings' and define e.g. a default Weight-variable. Read more about Table Settings.
Some tables settings are used again and again when specific variables are used in multiple tables, like e.g. in the table banner. You can define default settings for these variables in the Data Editor by selecting the variable and setting the 'Table Default Settings' for this variable, like sorting and significance test.
Table Filter
Besides being able to define filters for the whole report, you can also filter each table. You can define a filter by dropping a category (or variable) from the Data Editor on the data part of an existing table. Alternatively, you can create a filter in the 'Filter' tab of the table definition:
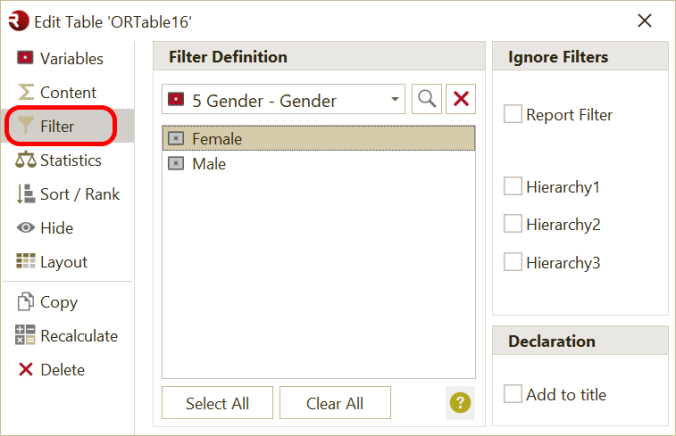
Here you also can edit the Filter.
Filter based on multiple variables
Using drag and drop, just drag the category of another variable on the table, and OfficeReports will automatically create the new filter. Otherwise, create a derived variable and create a category with a formula containing categories of all the variables that you need. You can ude the 'Formula Editor' to create this formula.
In case you e.g. need to filter on combinations of gender and age intervals, merge these 2 variables in the Data Editor and use the categories of the merged variable.
Table Types
Using OfficeReports, you can create the following types of tables:
- Frequency tables and Cross tables (crosstabs) - used for reporting a variable, maybe split by banner variable(s)
- Grid tables - used for reporting many variables in the same table, maybe split by a banner variable
- Aggregate tables - used for reporting questions asked multiple times (e.g. for different brands - first mentioned, second mentioned etc.)
- Performance tables - used to report worst and best performance
Editing Tables
After creating the table, OfficeReports will show the ‘Table Pane’ in Excel or the 'Edit Table' window in the OfficeReports App, where you now can adjust all settings for the table. Read more about editing tables here.
If you want to edit a table in the OfficeReports App, just double click the table, and the Edit Table window will popup. In Excel, just click in the table, and the Table Pane will appear.